- Posts: 170
- Thank you received: 0
JF Vented Horn
- jake_fielder
-
 Topic Author
- Offline
- Elite Member
-

Less
More
17 years 10 months ago #3982
by jake_fielder
Replied by jake_fielder on topic JF Vented Horn
BAM!
Proper impedance plot!
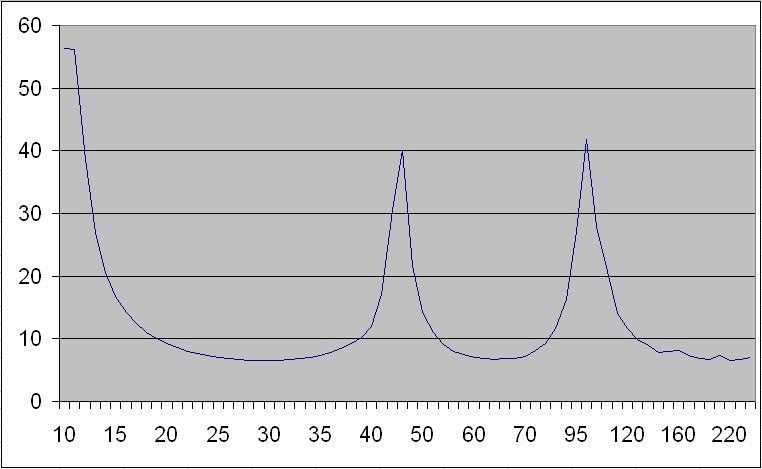
Compare:
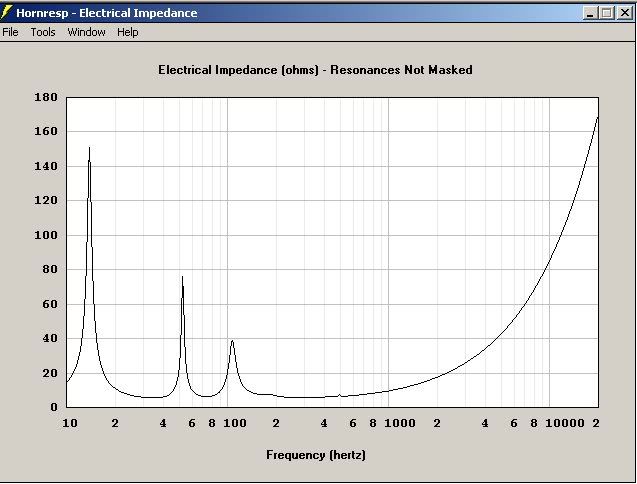
Proper impedance plot!
Compare:
Please Log in or Create an account to join the conversation.
- jake_fielder
-
Topic Author
- Offline
- Elite Member
-
Less
More
- Posts: 170
- Thank you received: 0
17 years 10 months ago #3983
by jake_fielder
Did it in the middle of my garden this time, it looks pretty much spot on! ( and i used a more precise multimeter )
I couldn't hear that peak anymorewith the cabin the middle of the garden.

Whadda you recon the tuning is? 34ish
Replied by jake_fielder on topic JF Vented Horn
jsg wrote:
Jake, this is excellent work. I waited before coming in as many people seem to abandon their projects before getting to the all-important tuning stage that you have now reached. Perhaps I can help here a little:
Jake_Fielder wrote: Im not experiancing any accoustic problems at that frequency,
You need to understand this artifact. Even if there are two peaks, neither seems high enough compared to the prediction. Try smaller frequency increments in that area.
Did it in the middle of my garden this time, it looks pretty much spot on! ( and i used a more precise multimeter )
jsg wrote:
Jake_Fielder wrote: its sounds great until you get to 100Hz then there seems to be a bigpeak in SPLuntil 102Hz then it levels out again.
Could be a room or boundaryeffect. this is why impedance measurement is easier to get right than SPL measurement. Try it outside.
I couldn't hear that peak anymorewith the cabin the middle of the garden.
Interesting ideas....JSG wrote:
Jake_Fielder wrote: Although i have not properly braced the cab yet or glued the top on,
You must do somehting to keep the cabinet rigid when testing. Try going to the local nightclub and getting some fat girls to come and sit on the sub. Or borrow some gold bars from the bank. Gold is quite heavy. Plus audiophiles can be made to believe all sorts of sound quality voodoo when you bring the old Au intothe equation. Alternatively, get oddjob from Goldfinger to hold the cabinet together tightly. He takes his hat off to a lady, you know.
Whadda you recon the tuning is? 34ish
Please Log in or Create an account to join the conversation.
- odc04r
-

- Offline
- Junior Member
-

Less
More
- Posts: 32
- Thank you received: 0
17 years 10 months ago #3985
by odc04r
Replied by odc04r on topic JF Vented Horn
That looks a bit better! Good work. Interesting that the ratio of the 2 peaks has dropped from 2:1 in simulation to 1:1 in reality, not sure what that means if anything myself.
Please Log in or Create an account to join the conversation.
- chaudio
-

- Offline
- Platinum Member
-

17 years 10 months ago #3987
by chaudio
Replied by chaudio on topic JF Vented Horn
Because the peaks are so sharp, the chances are that the maximum value will fall between two measurement points. When I did mine I found that the peaks were in the right place but the values were wrong. For the purposes of this, it's only the positions you're really interested in.
Also, losses in a practical cabinet made of real materials will probably mean that you won't get peaks as sharp as the simulation.
The interesting thing to do now is to try and adjust your simulation so that the peaks in that are the same as your measured cab and see what horn parameters you end up with.
I keep comparing my horn simulation/measurement to yours and I've realised one of the big differences in the impedance plot is caused by the driver differences. Yours has an FS of 30Hz whereas the L15P300 in mine is 40Hz. Explains why the lower two impedance peaks are much lower on yours.
Please Log in or Create an account to join the conversation.
- josh
-
- Offline
- Junior Member
-
Less
More
- Posts: 22
- Thank you received: 0
17 years 10 months ago #3989
by josh
Replied by josh on topic JF Vented Horn
What does an impedance plot tell you if you would excuse my ignorance
Please Log in or Create an account to join the conversation.
- jsg
-
- Offline
- Elite Member
-
Less
More
- Posts: 236
- Thank you received: 0
17 years 10 months ago #3991
by jsg
Hi Josh
Bass speakers work in different ways at different frequencies within their frequency range.
At some frequencies, the driver cone moves in accordance with the way the amp drives it, and the cabinet may add a little gain before the sound is emitted. At other frequencies the cabinet resists or impedes cone motion so the cone moves much less. However at these frequencies the cabinet will have more gain, so the actual frequency response can be flat (actually getting it flat is part of the art/science).
Now, the extent to which the cabinet is restricting driver cone movement can be seen in the impedance plot. That's because a moving voice coil develops a back-emf, which for sine wave input, can get close to but not greater than the drive voltage. An impedence meter detects that as a rise in impedance.
When the driver cone is unable to move, all you see is the resistence of the voice coil as one might expect.
We like impedance plots for a few reasons including:
- They can be made more accurately given basic equipment
- They are easier to read because of the big peaks (which are intentionally there)
- A design model can easily give a prediction for impedance, giving you something to compare against.
Ars est celare artem
Replied by jsg on topic JF Vented Horn
josh wrote: What does an impedance plot tell you if you would excuse my ignorance
Hi Josh
Bass speakers work in different ways at different frequencies within their frequency range.
At some frequencies, the driver cone moves in accordance with the way the amp drives it, and the cabinet may add a little gain before the sound is emitted. At other frequencies the cabinet resists or impedes cone motion so the cone moves much less. However at these frequencies the cabinet will have more gain, so the actual frequency response can be flat (actually getting it flat is part of the art/science).
Now, the extent to which the cabinet is restricting driver cone movement can be seen in the impedance plot. That's because a moving voice coil develops a back-emf, which for sine wave input, can get close to but not greater than the drive voltage. An impedence meter detects that as a rise in impedance.
When the driver cone is unable to move, all you see is the resistence of the voice coil as one might expect.
We like impedance plots for a few reasons including:
- They can be made more accurately given basic equipment
- They are easier to read because of the big peaks (which are intentionally there)
- A design model can easily give a prediction for impedance, giving you something to compare against.
Ars est celare artem
Please Log in or Create an account to join the conversation.
- studio45
-
- Offline
- Junior Member
-
Less
More
- Posts: 28
- Thank you received: 0
17 years 10 months ago #3992
by studio45
Replied by studio45 on topic JF Vented Horn
so the impedance is directly proportional to amount of cone travel, ie the peaks show the frequencies where one would want to calculate maximum excursion limited input power? and the troughs between show where eq can be used to boost output without over excursioning driver but having to stay within thermal dissipation limits?
can impedance plots of smaller midrange and hf horns be used in the same way?
can impedance plots of smaller midrange and hf horns be used in the same way?
Please Log in or Create an account to join the conversation.
- jsg
-
- Offline
- Elite Member
-
Less
More
- Posts: 236
- Thank you received: 0
17 years 10 months ago #3994
by jsg
Ars est celare artem
Replied by jsg on topic JF Vented Horn
Sort of.
Actually the impedance is the phasor sum of voice coil DC resistance and impedance due to back-EMF. The latter is proportional to cone velocity, not displacement. Since velocity=diusplacemant times frequency (angular), the peak displacement frequency is slightly lower, maybe a couple of Hz. But you get a rough idea.
Also remember that an actual plot of excursion shows the *dips* as quite narrow, so your chance to exploit them isn't that great. I always design for the worst-case which is the highest excursion in band (but I allow a certain margin over xmax).
Ars est celare artem
Please Log in or Create an account to join the conversation.
- jake_fielder
-
Topic Author
- Offline
- Elite Member
-
Less
More
- Posts: 170
- Thank you received: 0
17 years 10 months ago #3996
by jake_fielder
Replied by jake_fielder on topic JF Vented Horn
Yeah, the wide dips on the impedance graph arenowhere near what the xmax graph looks like. the xmax graph will dip over a very narrow frequency.
@Josh, impedance plots kinda let you see whats going on and how close the cab is to thepredicted response,I'm mainly using it to check the tuning frequency's.
What do people reckon the tuning frequency of the port is? I thinks its about 35... it seems to be to the right hand side of the first impedance dip in simulation, (or just to the left of the first peak, however you wanna think about it)
EDIT: my impeadence spelling!Edited by: Jake_Fielder
Please Log in or Create an account to join the conversation.
- subsoniks
-
- Offline
- Junior Member
-
Less
More
- Posts: 20
- Thank you received: 0
17 years 10 months ago #4011
by subsoniks
Replied by subsoniks on topic JF Vented Horn
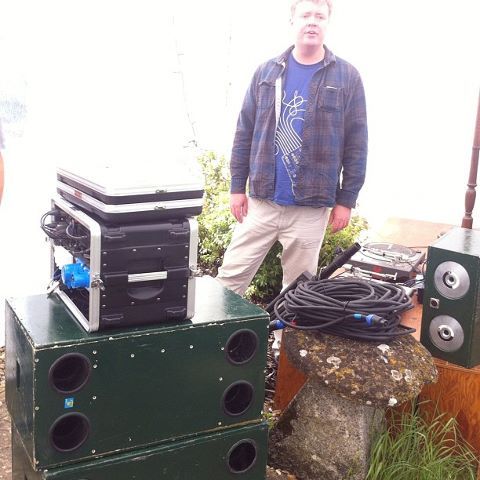
Nice to see your build pics.
As for the tuning frequency, I would guess the tuning frequency to be about 30Hz as that is the area of lowest impedance, if the software can graph the phase response then the point it intersects zero degree's will be pretty much bang on the tuning frequency.
JaKe[img]smileys/smiley32.gif[/img]
As for the tuning frequency, I would guess the tuning frequency to be about 30Hz as that is the area of lowest impedance, if the software can graph the phase response then the point it intersects zero degree's will be pretty much bang on the tuning frequency.
JaKe[img]smileys/smiley32.gif[/img]
Please Log in or Create an account to join the conversation.
Time to create page: 0.827 seconds